By Jourdan Rombough, Optimization Theory · Updated · 90 days of data from three of my own sites
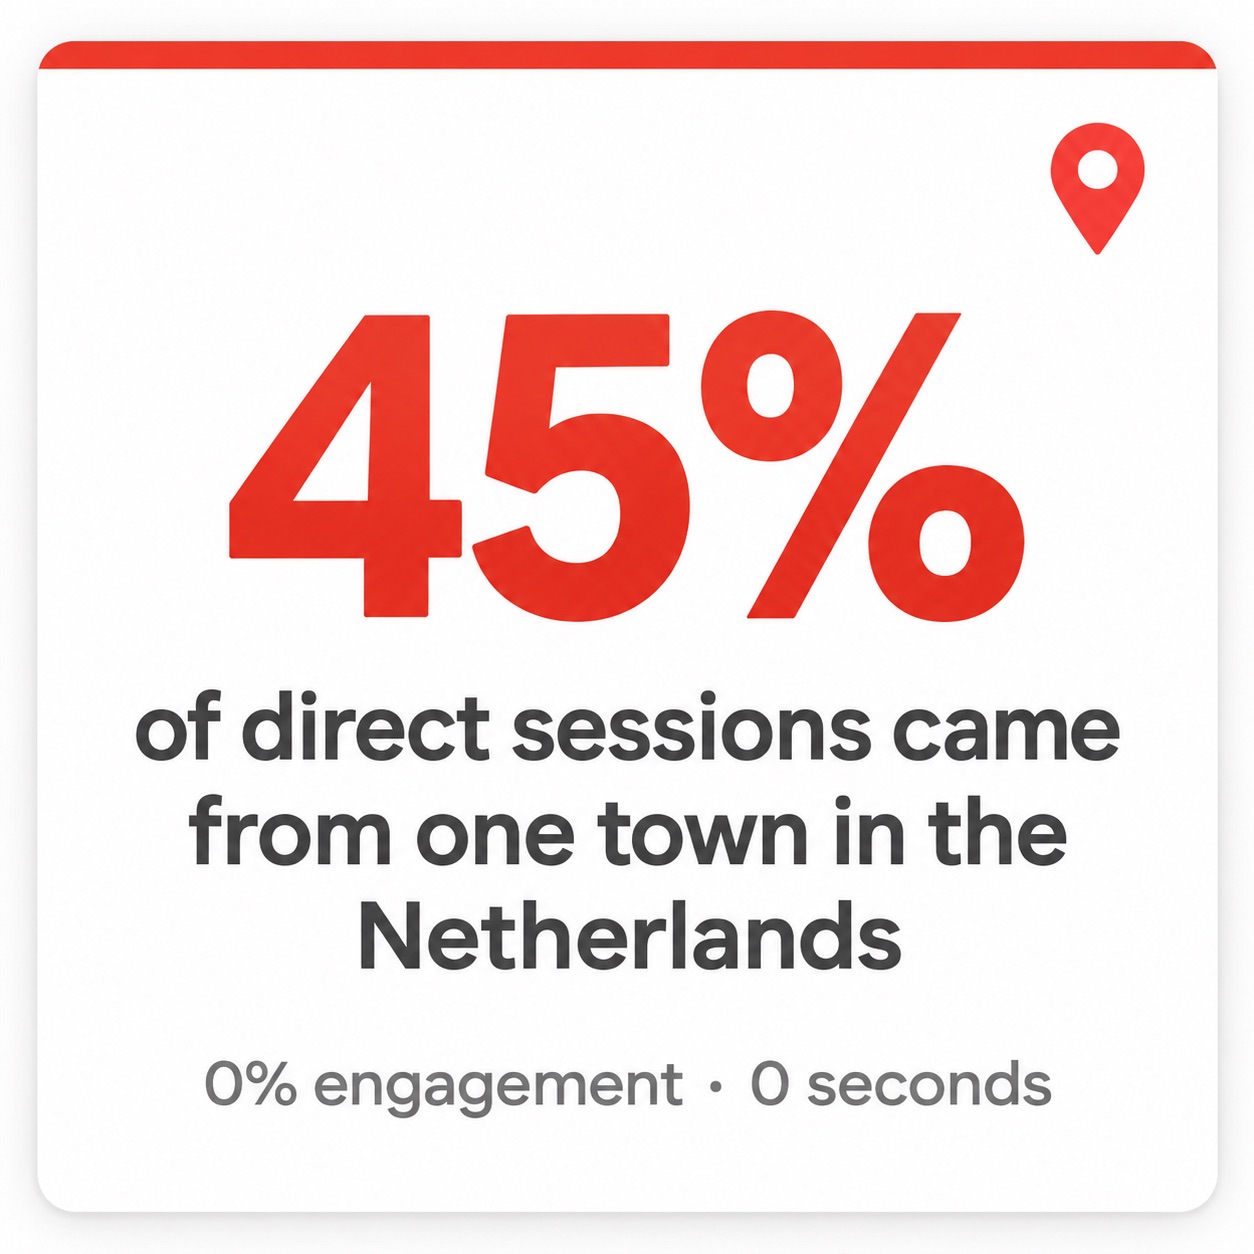
Nearly half of the "direct" traffic on one of my sites came from a single town in the Netherlands, stayed 0 seconds and engaged 0% of the time. Default GA4 reports showed it as healthy direct traffic. The power setup found it in one card.
This is Part 3 of my GA4 series, and the payoff post. In Part 1 I rebuilt the tracking. In Part 2 I built six SEO dashboards. Here I pointed all of it at the last 90 days on optimizationtheory.com, vuss.io and infographi.ac and wrote down everything that default GA4 was hiding. Every screenshot is real data from my own properties.
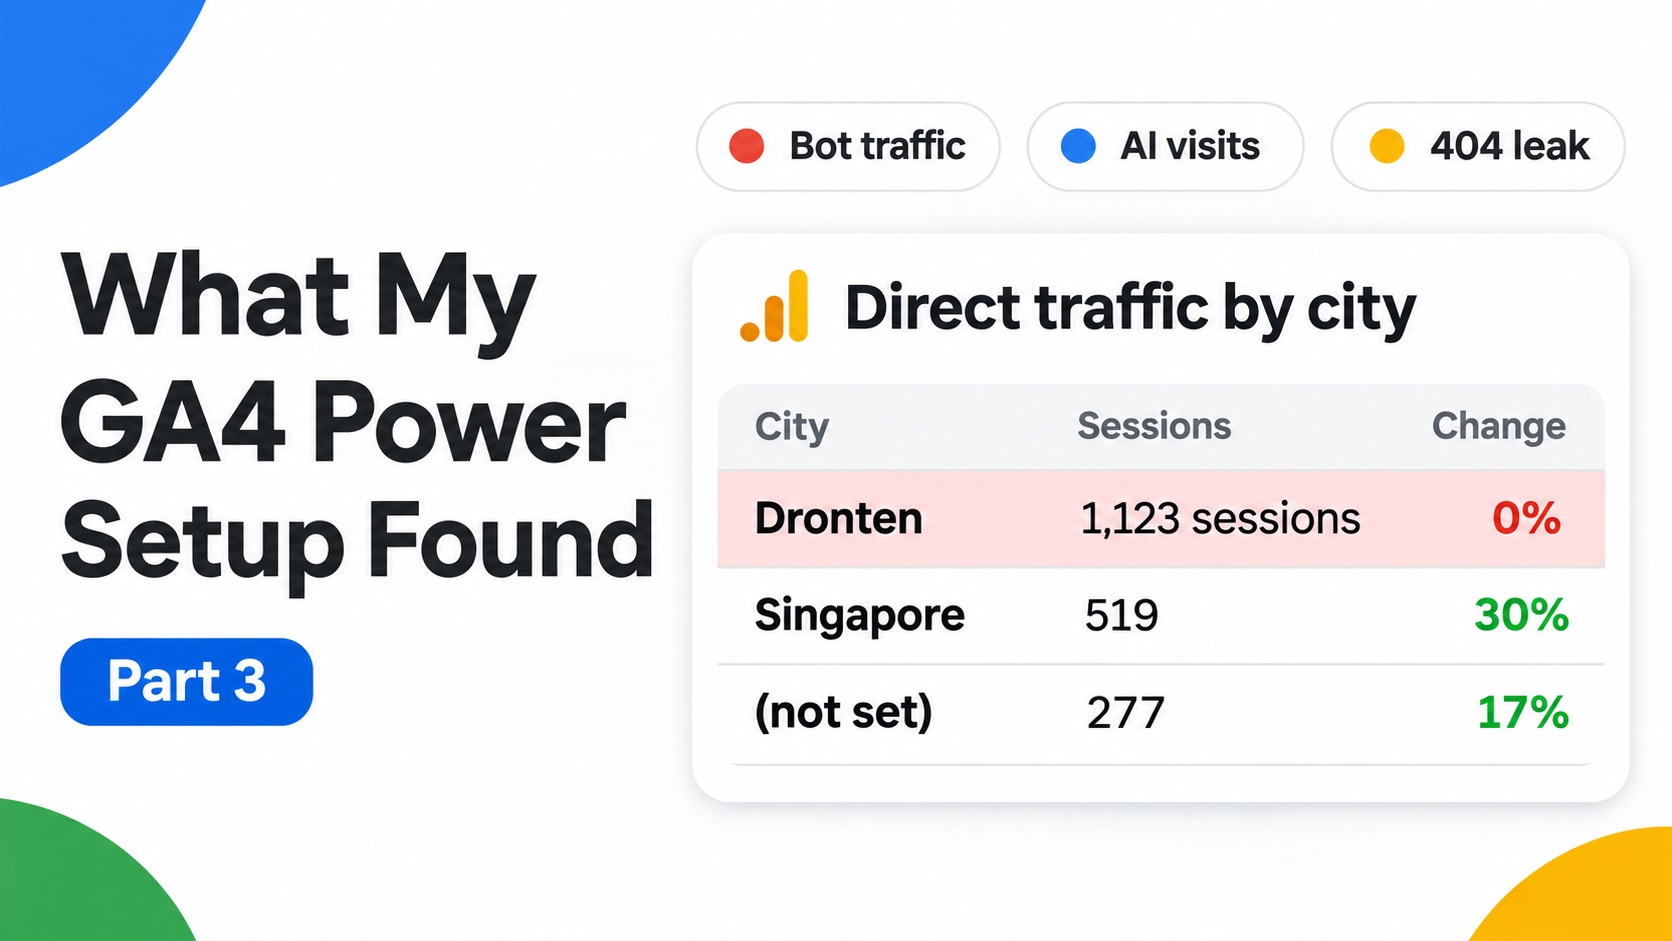
Direct traffic by city on vuss.io. The right-hand column is engagement rate.
45%of vuss.io's direct sessions came from one Dutch town, at 0% engagement
67%engagement rate for AI assistant visits, vs 19% for direct
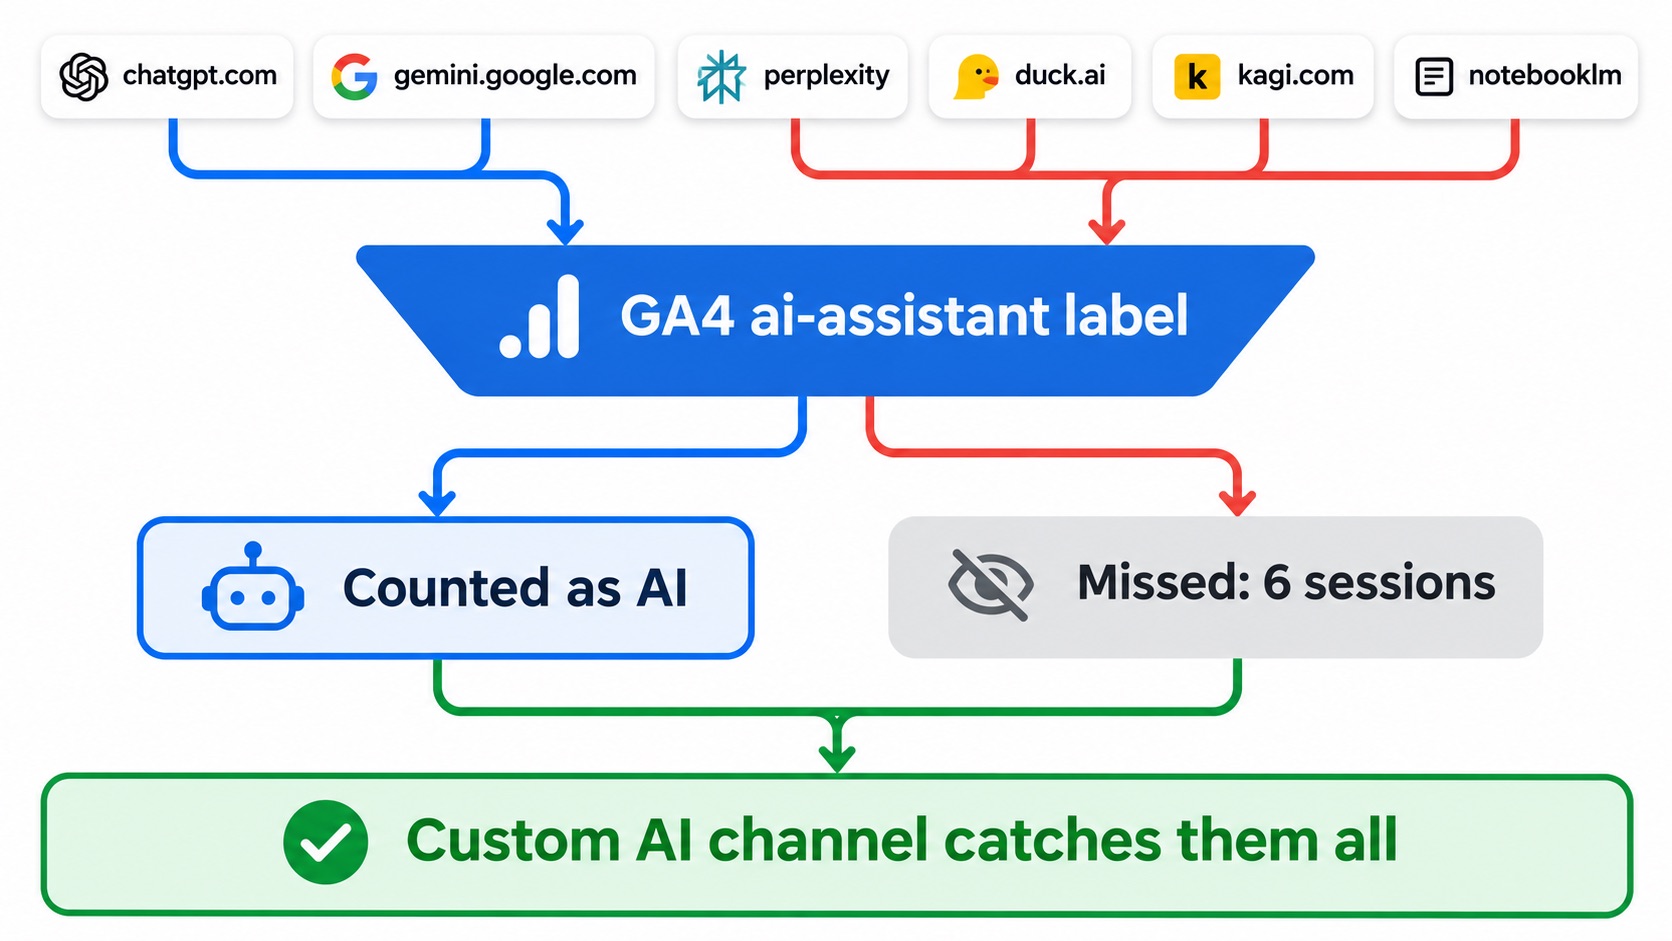
6AI-source sessions arrived without Google's ai-assistant label
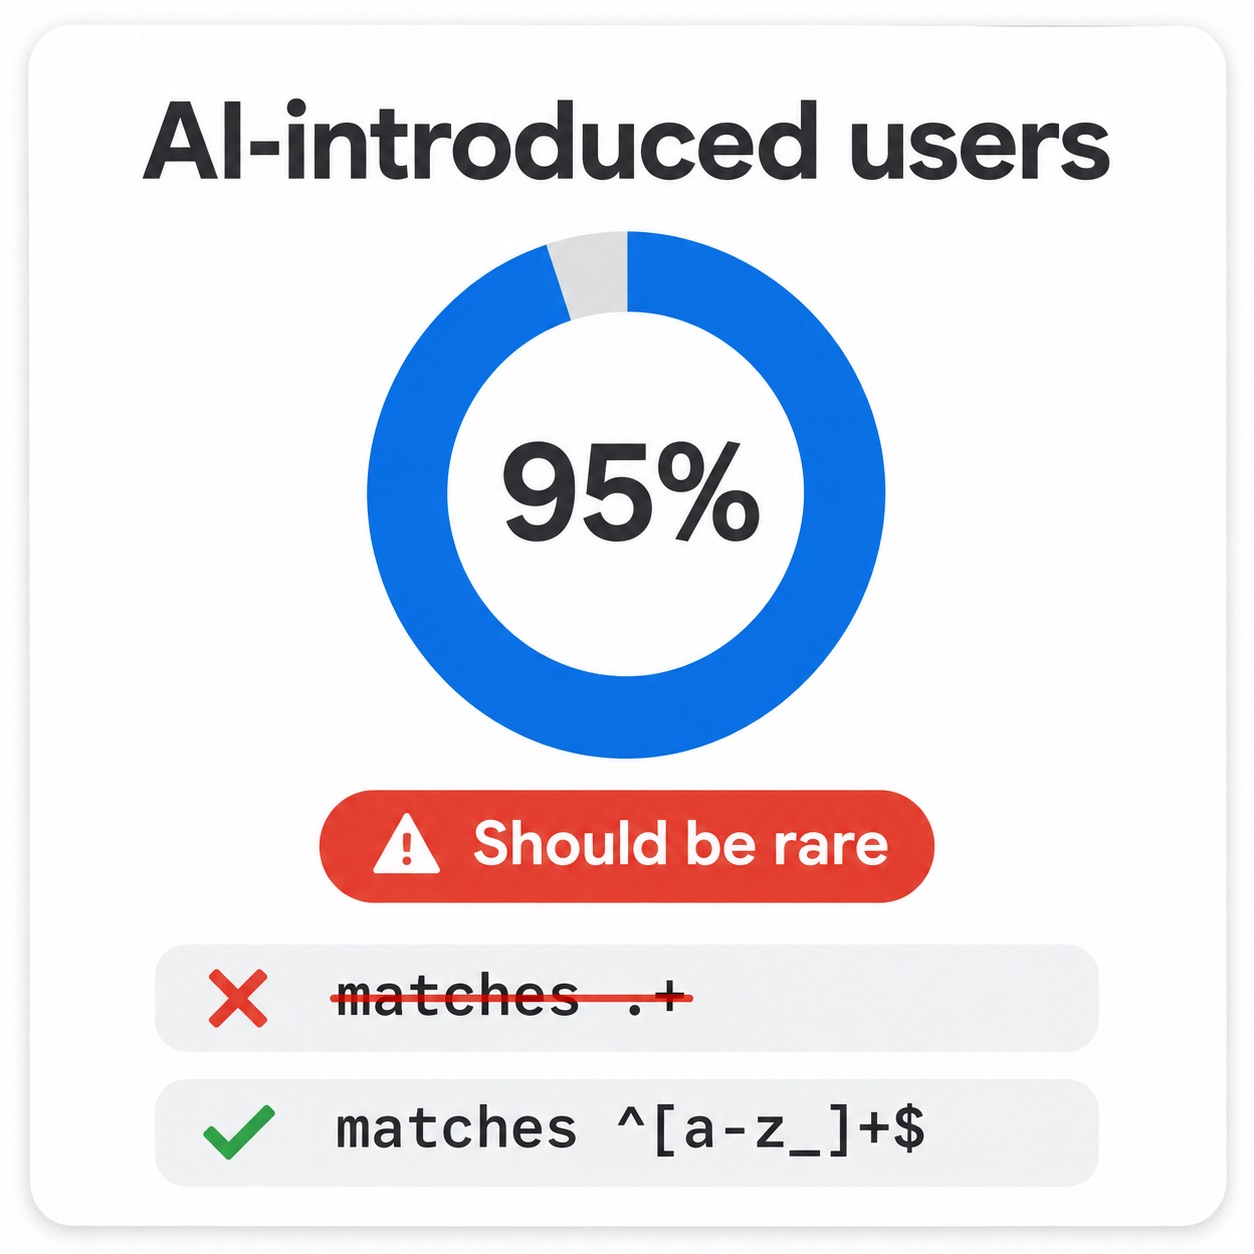
95%of users can land in a "rare" audience built with one loose regex
vuss.io figures are for July 25 to October 22, 2026, from the AI-Aware channel group (retroactive) and standard dimensions. Custom parameters such as engaged_read and traffic_quality only exist from October 22, when the new tracking went live.
Direct traffic was mostly a data center
What is direct traffic in Google Analytics? In theory, people who typed your URL, used a bookmark or clicked a link that carried no referrer. In practice, it is the channel where anything without a source ends up, and that includes automated traffic.
On vuss.io, direct was 2,480 sessions over 90 days at a 19% engagement rate, against 63% for organic search. That gap was the first clue. Splitting direct by city made the answer obvious:
vuss.io direct sessions by city, last 90 days
City
Direct sessions
Share of direct
Engagement rate
Dronten, Netherlands
1,123
45%
0%
Singapore
519
21%
30%
(not set)
277
11%
17%
Everything else
561
23%
Mostly normal
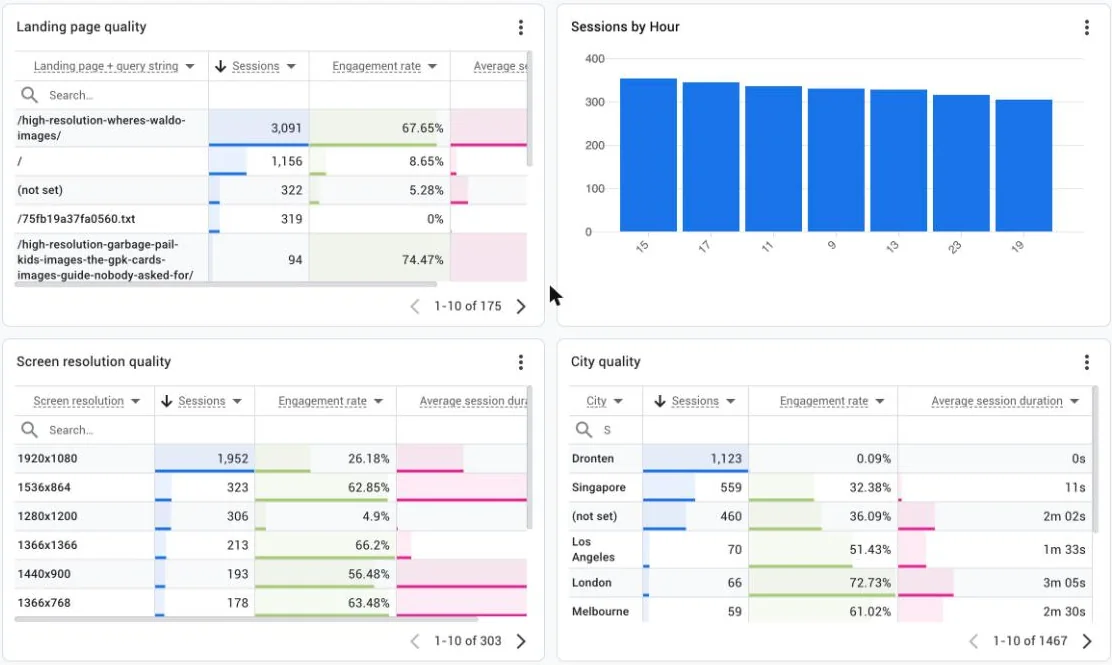
1,123 sessions from a single town, one engaged session in the whole lot, an average session of 0 seconds. Dronten is home to at least one commercial data center (Solcon Dronten), which is the usual explanation when a small town outranks whole countries in a GA4 report. Take Dronten out and direct engagement on vuss.io jumps from 19% to about 35%.
Why this matters for SEO reporting. Direct traffic inflates "users," drags down site-wide engagement and makes every organic win look smaller as a share of total. If you report site totals to a client, you are reporting bots.
Update, November 11. The Dronten bot ran from about October 4 to November 5, then stopped on its own, with zero sessions since November 6. It was also the only visitor to the missing key file covered further down: all 712 hits. The follow-up carries a lesson for anyone who labels traffic quality in the browser: a headless browser passes every check a page can run on itself, so a client-side "clean" label misses it. City, operating system and screen resolution cards catch what tag-level checks cannot. For honest period comparisons, save a GA4 comparison that excludes the bot's city and add an annotation for the dates it ran.
The bot fingerprints, card by card
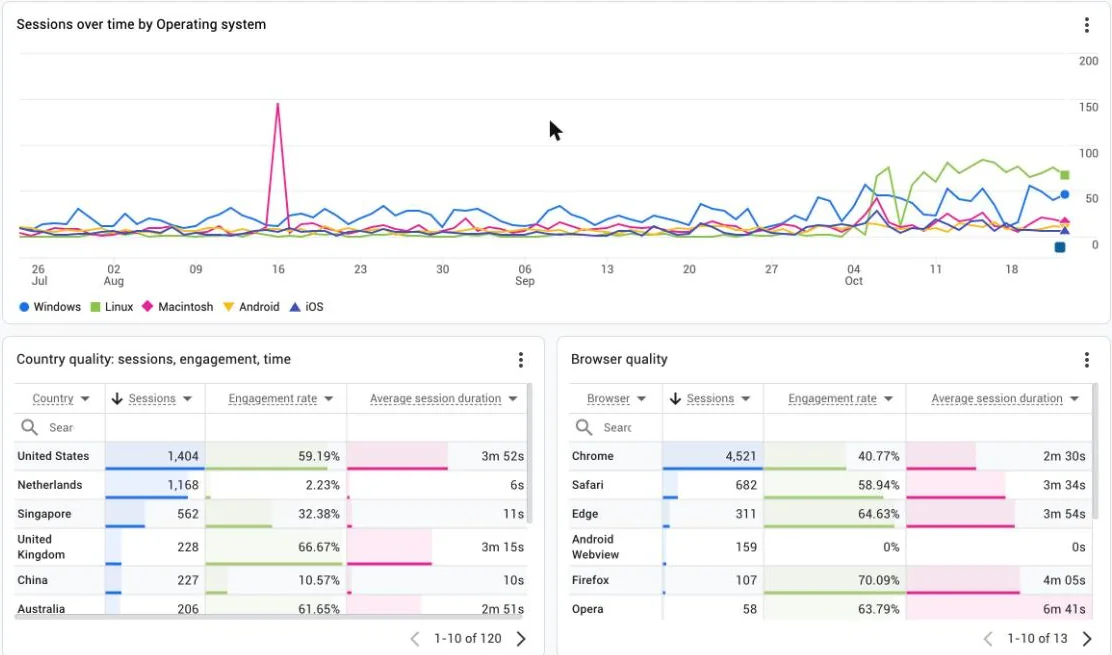
To see it properly I added one more dashboard to the set from Part 2: Bot Forensics. Twelve cards, all standard dimensions, so it works on 90 days of history, not just the days since the new tags went live.
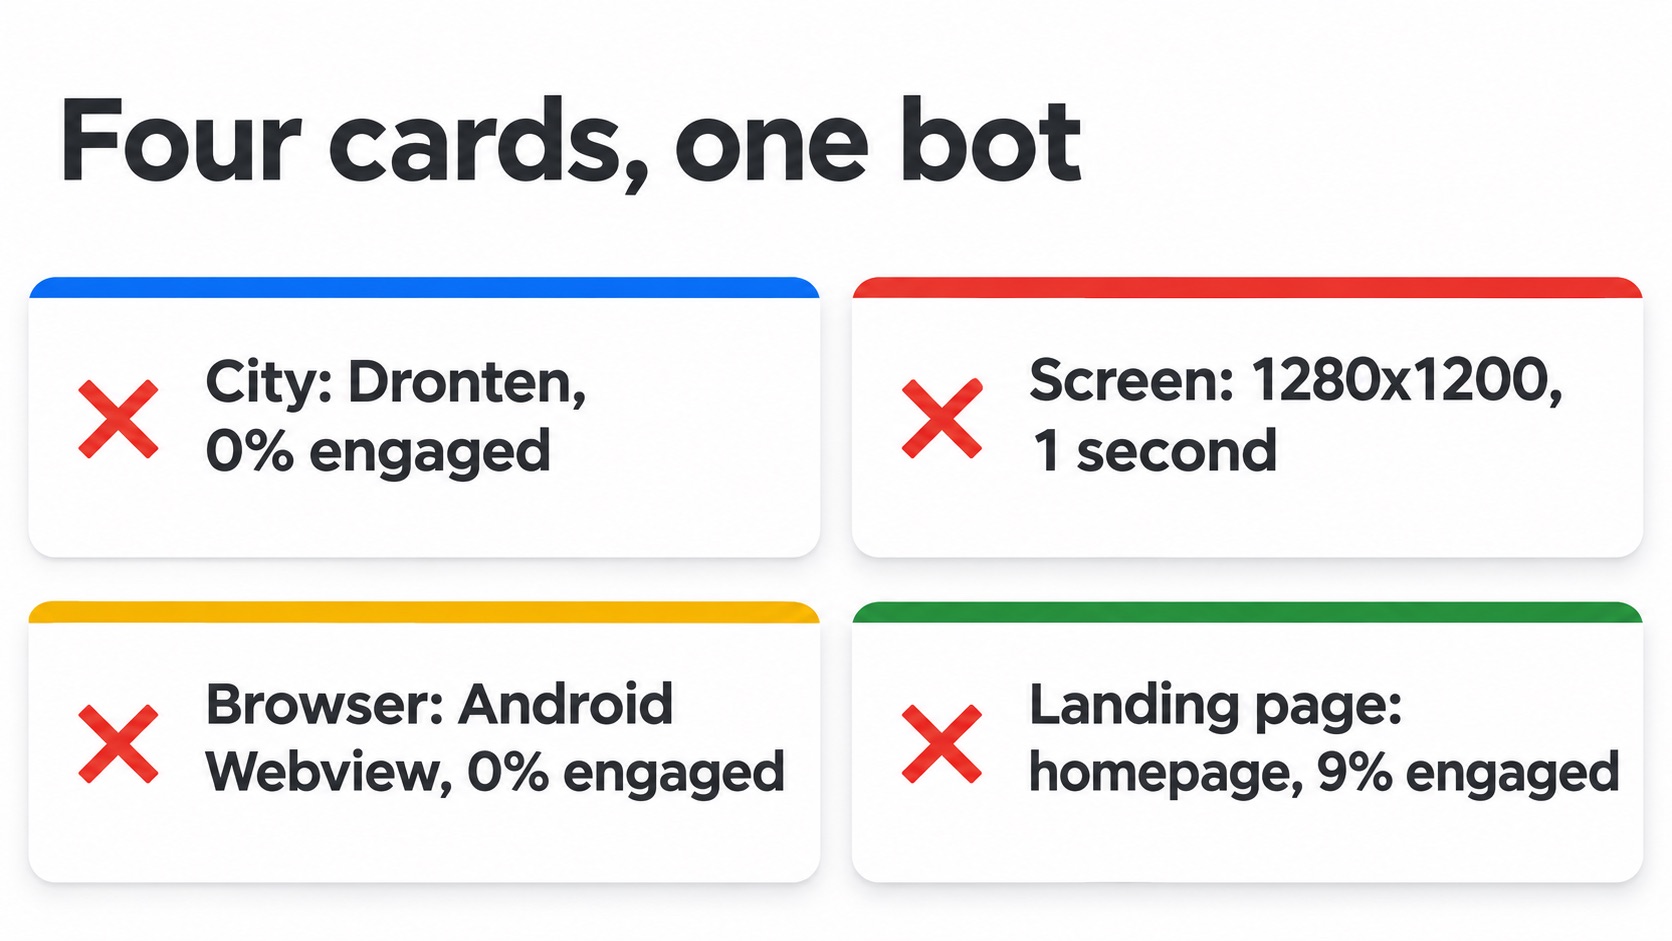
✕Landing page. The homepage took 1,156 sessions at 9% engagement. Real visitors land on the Waldo post at 68%.
No single card proves anything. Four cards pointing at the same 1,100 sessions does. Build the dashboard with the URL pattern from Part 2 or by hand: KPI row, sessions over time by operating system, then country, browser, landing page, hour, screen resolution and city tables, each with sessions, engagement rate and average session duration.
When direct overtook organic
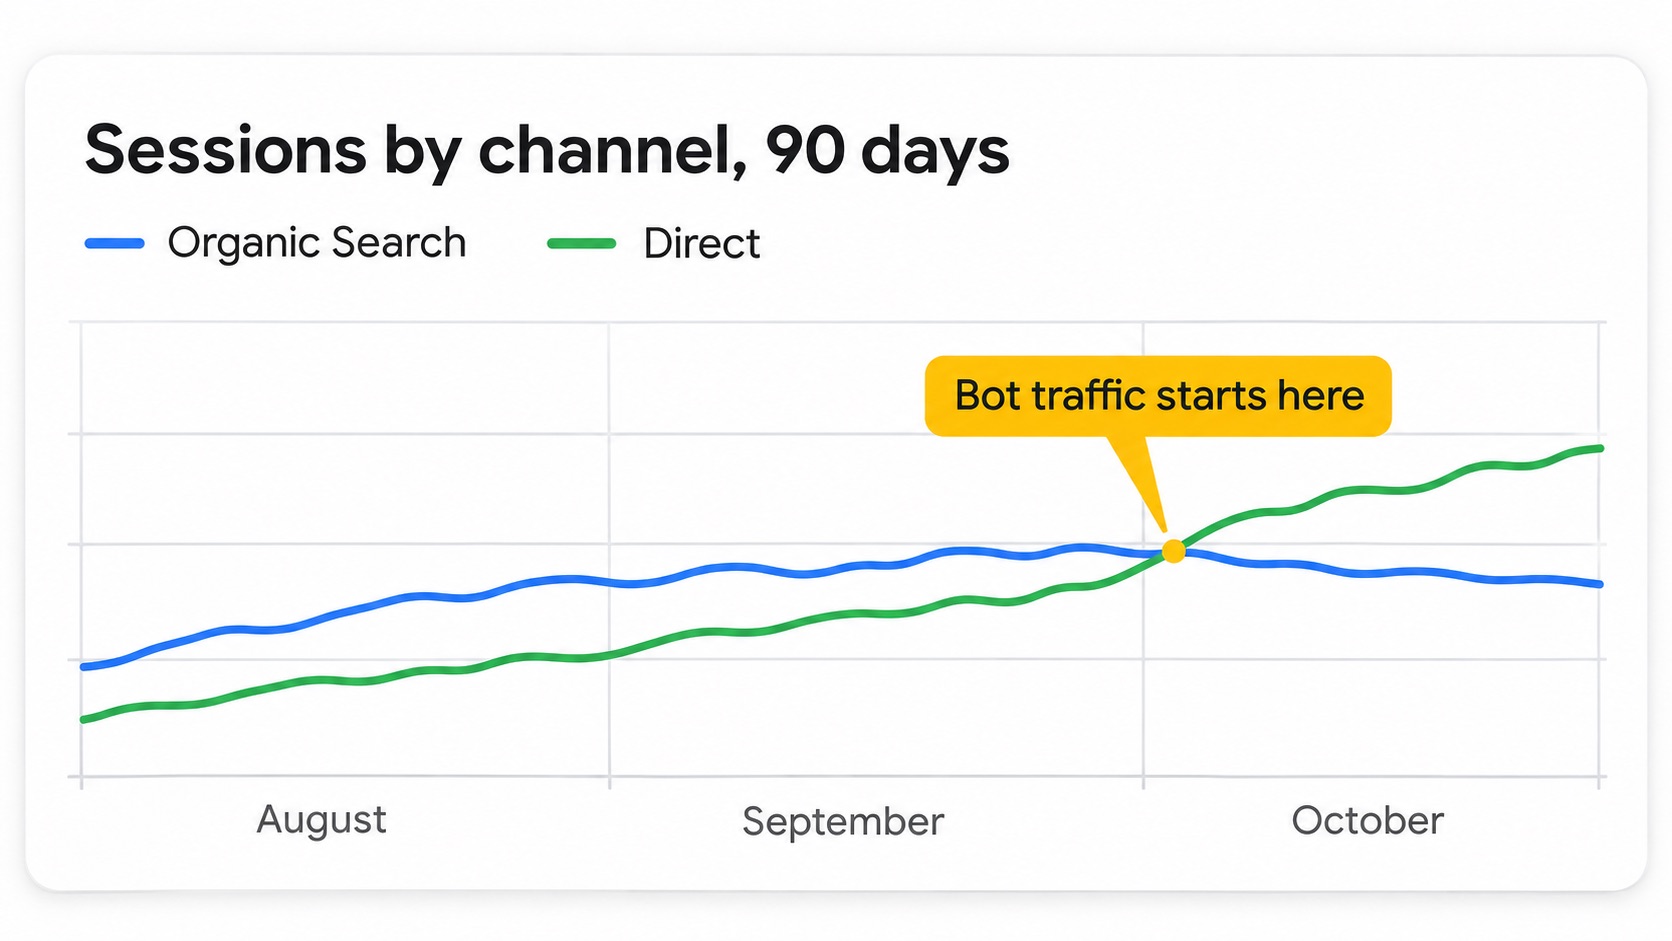
The 90-day channel chart shows when it started. Through September, organic search led every day. In early October, direct jumped and stayed above organic most days, and the operating system chart shows Linux, rarely a big share of real visitors on a pop-culture site, climbing to the top at the same time.
Illustration: direct passes organic when the bot arrives. The real chart is below.
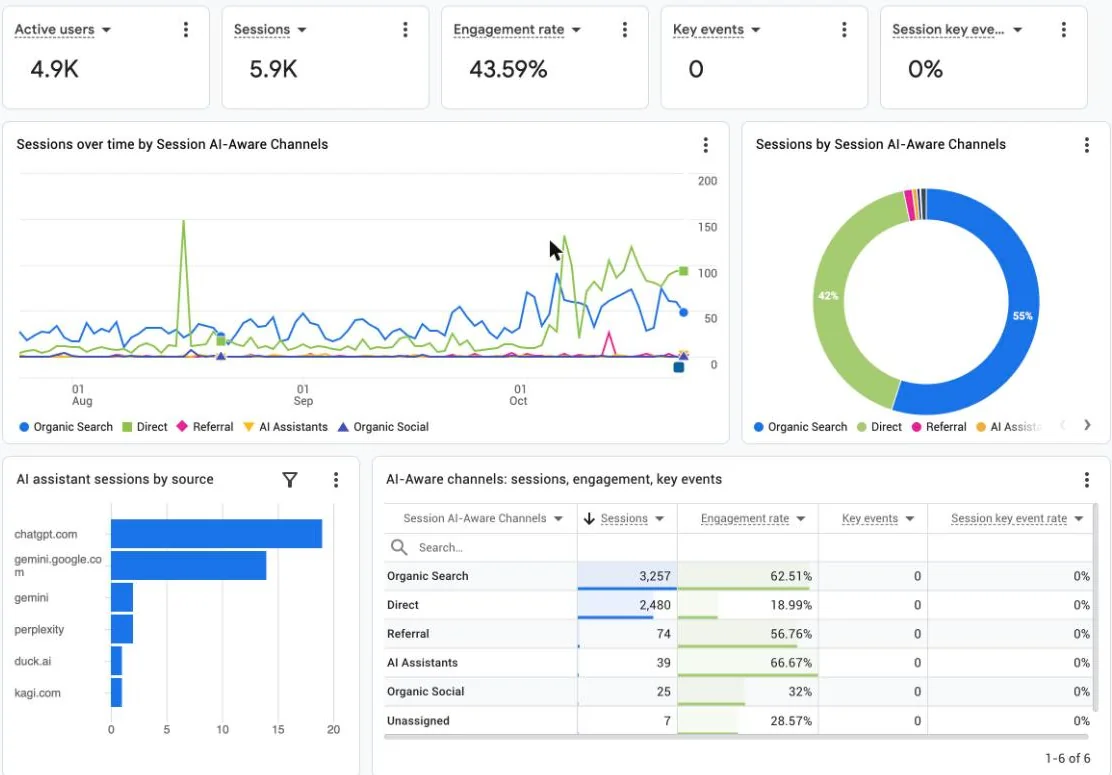
GA4 › Custom dashboards › SEO & GEO Power Center (vuss.io, 90 days)
Direct (green) passes organic (blue) in October. The channel table puts AI Assistants at 67% engagement and direct at 19%.
Two things worth noticing in the same screenshot. The single-day direct spike in mid-August is a separate burst that a "last 28 days" view would never show. And the chart reads correctly across all 90 days only because it uses the custom AI-Aware channel dimension, which is retroactive. The primary channel group would have switched labels halfway through.
Some "organic" traffic is not organic
Bots do not only arrive as direct. Two rows in the source and landing page cross-tab stood out:
✓google / organic with a "(not set)" landing page: 263 sessions at 6% engagement. A real Google visit lands on a page. Sessions with no landing page are either tags firing without a page_view or visitors spoofing a Google referrer.
✓google / organic from one city: 42 sessions from Matamoros at 10% engagement, while London, Melbourne and Sydney organic sit between 60% and 71%.
Neither is large, but both inflate the organic line in every client report. Pairing source with landing page and city is the fastest way to find them.
AI visitors: rare, and the best on the site
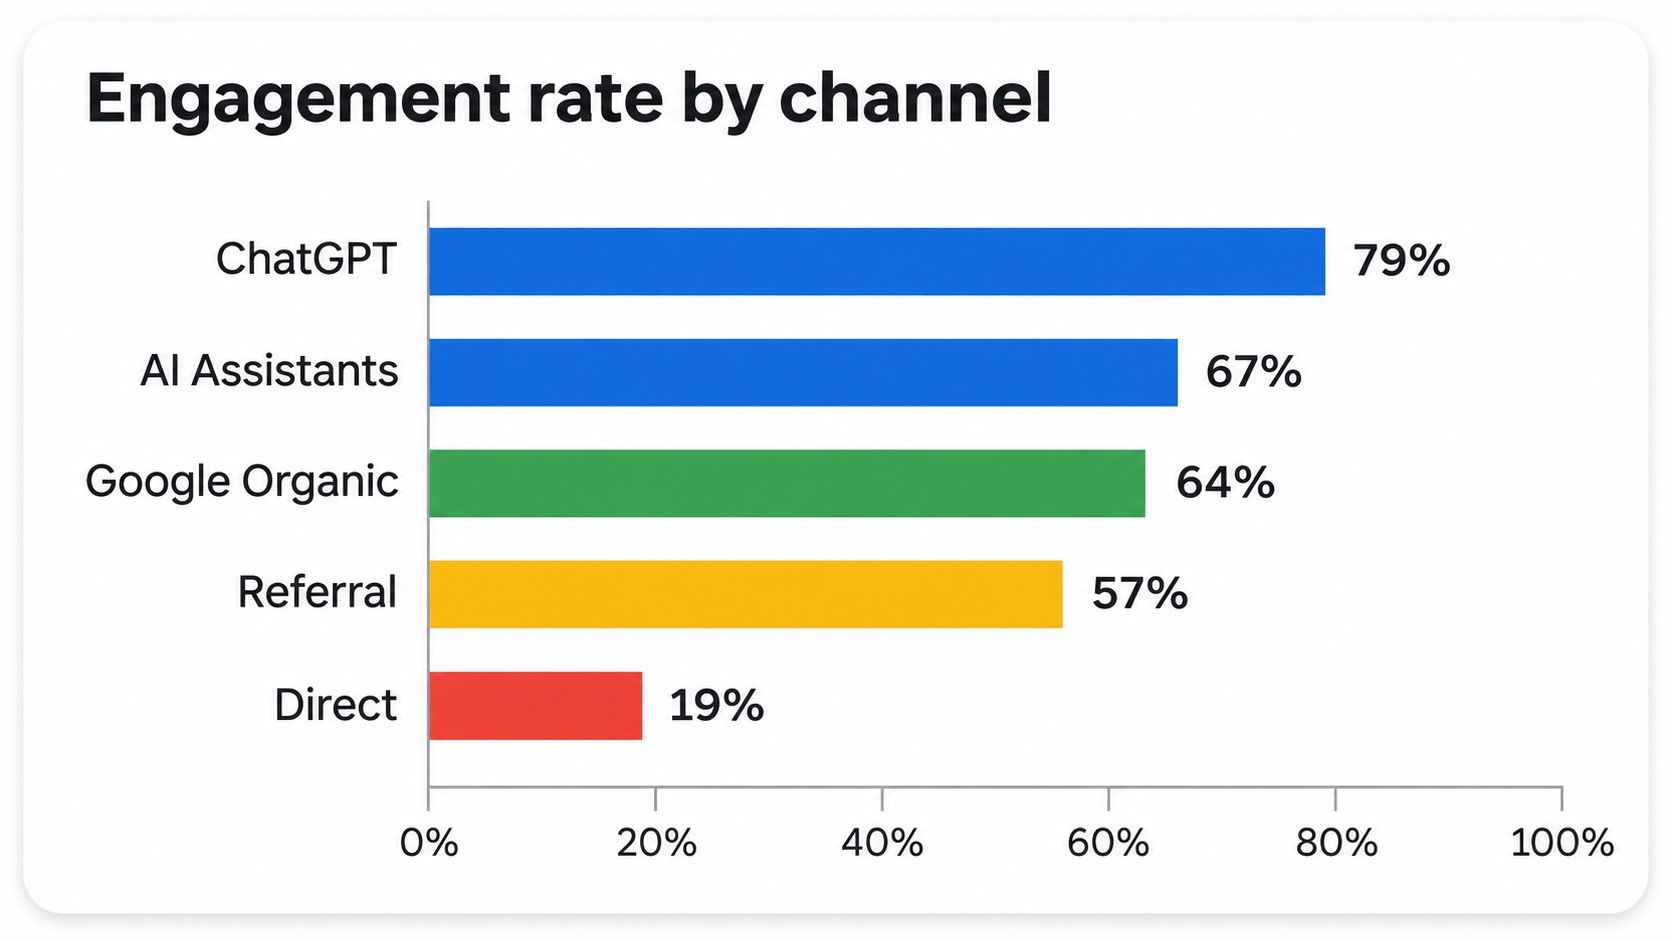
AI assistants sent vuss.io 39 sessions in 90 days. That is about 1% of traffic, in line with the studies cited in Part 1 that put AI platforms under 1% of visits. On engagement they beat everything:
vuss.io engagement by channel, last 90 days
Channel or source
Sessions
Engagement rate
Avg session
chatgpt.com / ai-assistant
19
79%
4m 42s
AI Assistants (all)
39
67%
google / organic
2,998
64%
4m 12s
Referral
74
57%
Direct
2,480
19%
52s
The AI landing page card showed where those visitors go: 25 of the 39 sessions landed on one post, the Where's Waldo image guide, which is also the site's top organic page. AI assistants are citing the same page Google ranks. That is a GEO signal worth acting on: keep that page fresh, quotable and fast, because two kinds of search depend on it.
Start tracking before the channel is big. AI referrals are a small share of traffic on most sites today. Building the channel now gives you a full year of history by the time they grow. The setup in Part 1 starts collecting from day one.
What Google's ai-assistant label misses
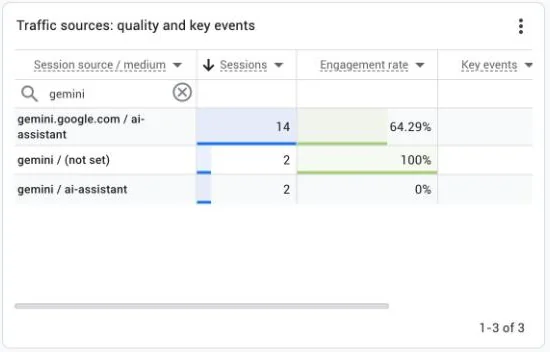
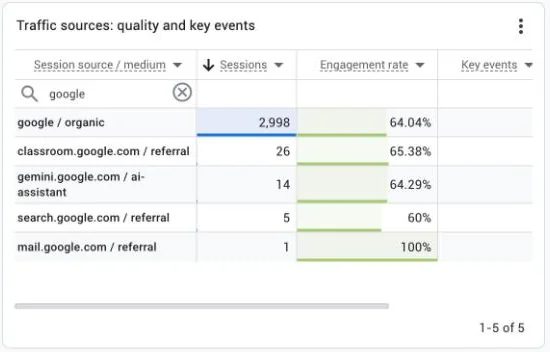
Since May 2026, GA4 gives recognized assistants the medium ai-assistant. On vuss.io, 35 sessions carried it. Six more came from AI sources that it missed. Searching the source table for "gemini" shows the problem:
Three versions of Gemini. Only two get Google's AI label.
AI sources outside Google's ai-assistant medium (vuss.io, 90 days)
Source / medium
Sessions
Why Google missed it
perplexity / (not set)
2
UTM source with no medium
gemini / (not set)
2
UTM source with no medium
duck.ai / referral
1
Assistant not on Google's list
kagi.com / referral
1
Search engine with an assistant; a judgment call
A custom AI channel with a source regex, plus an OR rule on medium = ai-assistant, catches all of them. On a channel this small, six sessions is about 15% of the total, and it is the part of AI traffic that grows when assistants start tagging links differently.
NotebookLM shows up as a referral
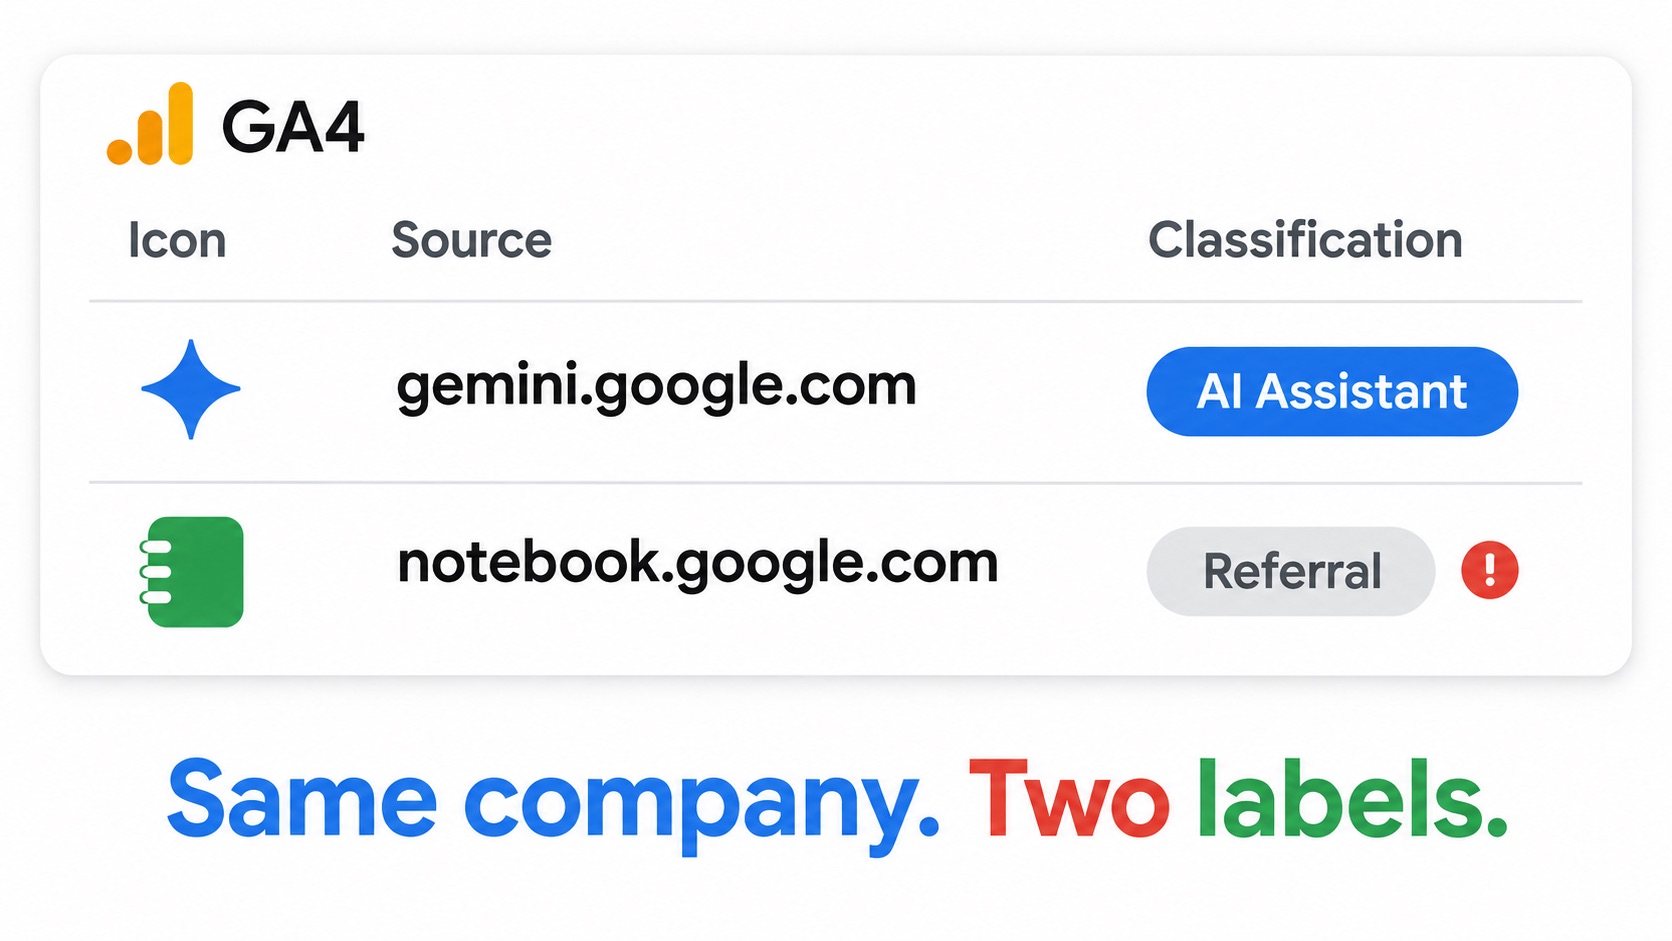
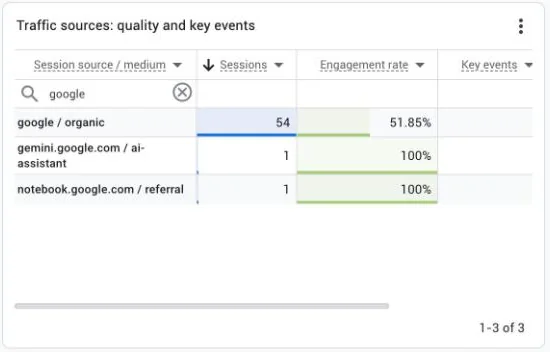
Search the source table for "google" and you will likely find the same split I found on Optimization Theory. Gemini gets the AI label. NotebookLM, also a Google AI product, comes in as notebook.google.com / referral, and that visitor stayed almost 7 minutes.
Same company, two labels. NotebookLM visits land in Referral.
A NotebookLM referral usually means someone added your page to a notebook as a source and clicked through to it. That is a citation, just not one any AI report would count. The fix is one more pattern in the AI channel regex: notebook\.google|notebooklm, which covers both NotebookLM hostnames. The same search is worth running for other reasons too; on vuss.io it also showed 26 sessions from classroom.google.com at 13 minutes each, most likely teachers sharing a page with a class, and worth knowing about for a completely different reason.
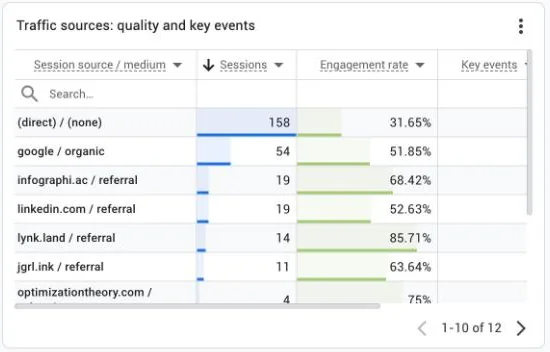
On optimizationtheory.com, the referrals from my other sites outperform organic search on every engagement metric. Infographi.ac sent 19 sessions at 68% engagement and 16 minutes each. lynk.land converted 86% of its sessions into engaged ones. jgrl.ink visitors averaged 24 minutes.
Sister-site referrals: small numbers, highest engagement on the property.
This is what the Network property and the network_click event from Part 1 are for. A month from now, the Network Flow dashboard will show which pages and which link positions send these visitors, so I can put more of them where they work.
The audience that matched everyone
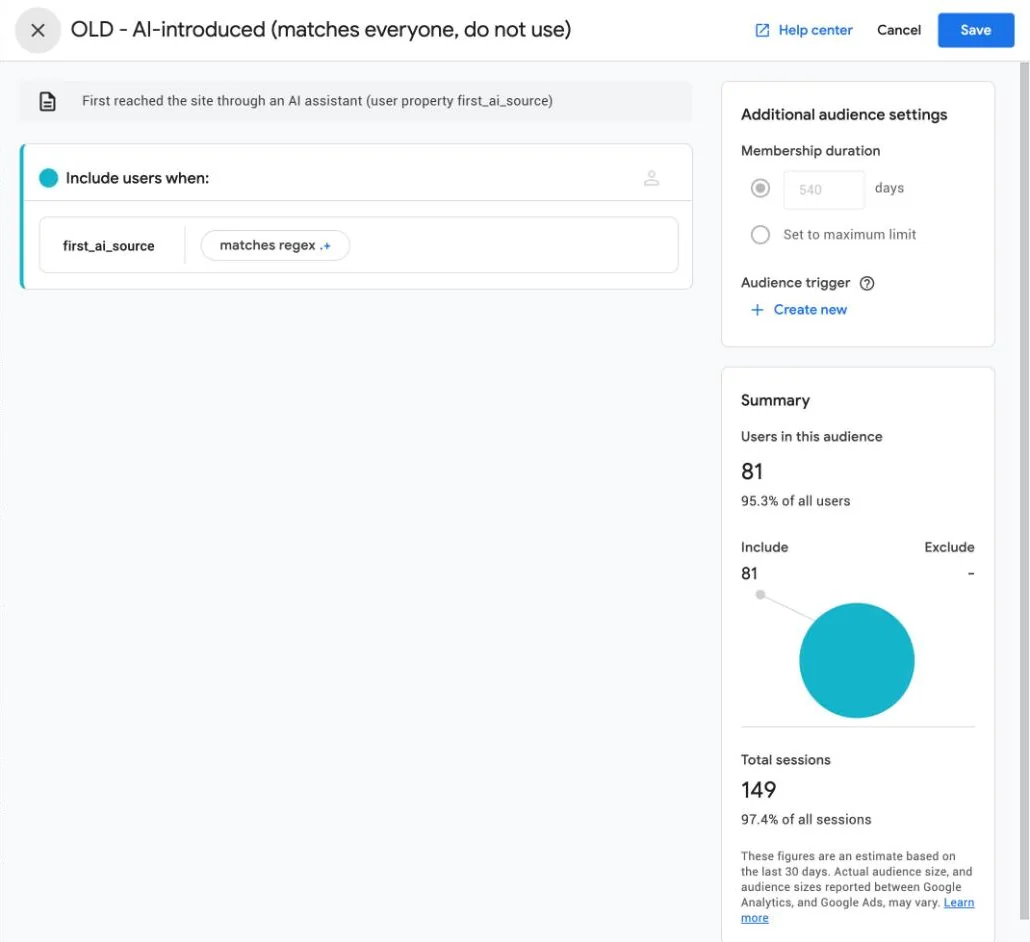
This is one of the easiest GA4 mistakes to make, and it quietly breaks every report built on the audience. Picture an audience called "AI-introduced users" with one condition: the user property first_ai_source matches regex .+, meaning "has any value." It looks right. On a live property, that audience previewed at 95% of all users, and Realtime showed every active user in it.
GA4 › Admin › Audiences › Edit audience
"matches regex .+" on a user property: 81 users, 95% of the property.
The tag is not the problem. Non-AI visitors never send first_ai_source at all. The audience builder treats a missing user property as the string "(not set)", and "(not set)" matches .+. The fix is a pattern that cannot match punctuation: ^[a-z_]+$. With it, the preview drops to the users who actually carry a value.
✓Audience conditions cannot be edited after you save. Only the name and description can. Duplicate the audience, fix the condition, save the copy and archive the original.
✓Check the summary before saving. An audience that is supposed to be rare should preview as rare. A number like 95% is the warning.
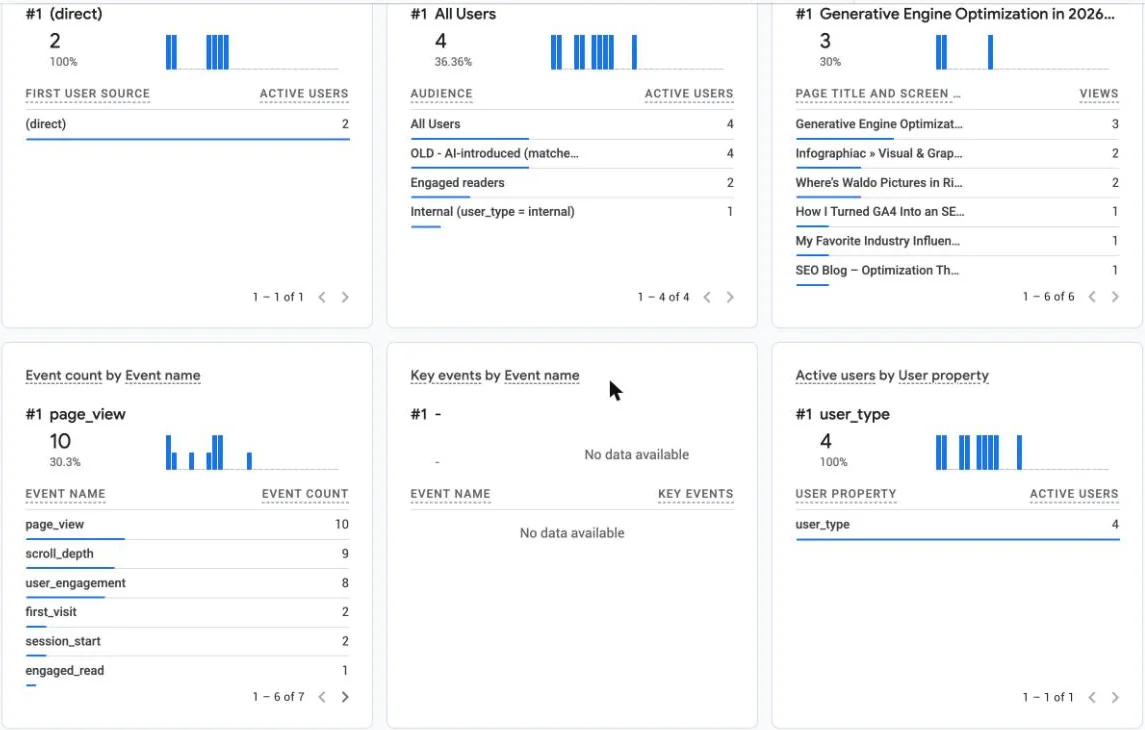
GA4 › Realtime overview (Network property)
Realtime shows the loose audience holding all 4 active users, next to scroll_depth and engaged_read events arriving from the new tags.
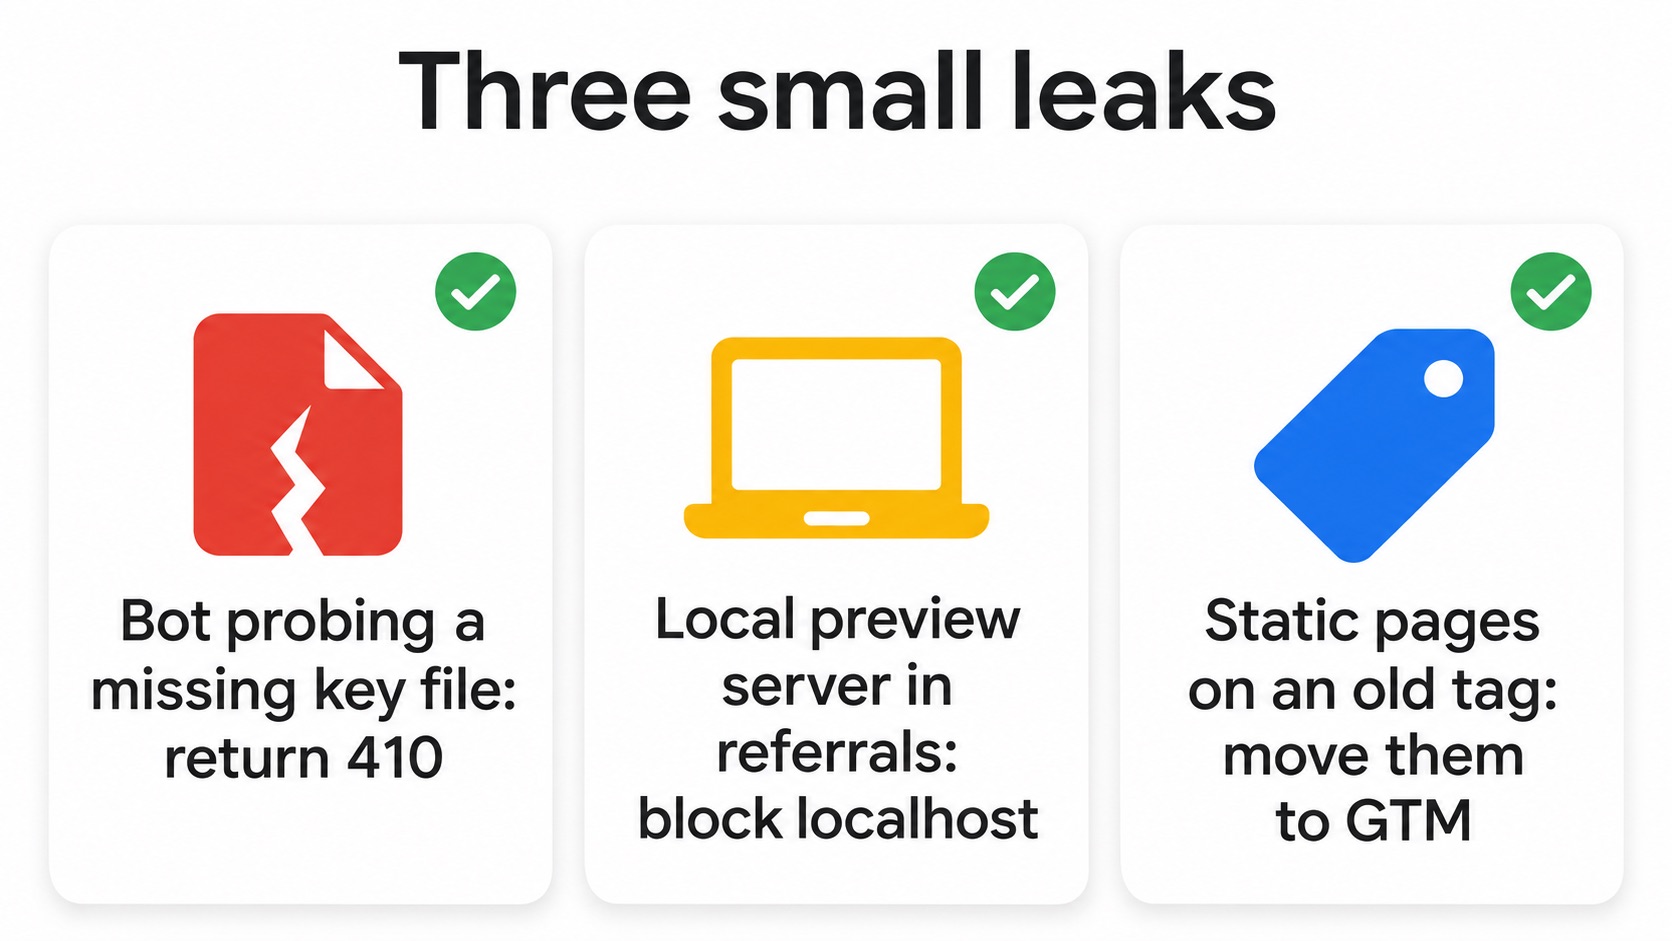
Three small leaks worth fixing
✕A missing file with 320 visits./75fb19a37fa0560.txt on vuss.io returned "Page not found" 320 times in 28 days, all as direct traffic. A random hex filename at the root is the pattern of a verification or key file, and a bot requesting one that does not exist is a common probe. Part 2's 404 finder catches it. Here, every hit came from the Dronten bot, 712 in total before it stopped. The fix has two parts: return 410 Gone for the file before WordPress loads, and add a GTM rule that stops GA4 from firing on random hex .txt paths, so the next bot that probes for a key file never reaches your reports.
✕Local development traffic. A preview server at 127.0.0.1:8768 showed up as a referral on infographi.ac with 21 sessions at 86% engagement and 8.5 minutes each, the fourth biggest source on the site. Anyone who previews pages locally can leak traffic this way. Add 127.0.0.1 and localhost to unwanted referrals and to the internal traffic rule.
✕Pages the new tags never reach. Static HTML files outside WordPress often keep an old hardcoded tag. On optimizationtheory.com the busiest pages were exactly that: they reported page views but none of the AI source, reading or quality data, and nothing reached the Network property. Moving them to the GTM container (57 files, plus six that had no tracking at all) closed the gap. Every site has a corner like this; check the page source of your top 10 pages, not just the homepage.
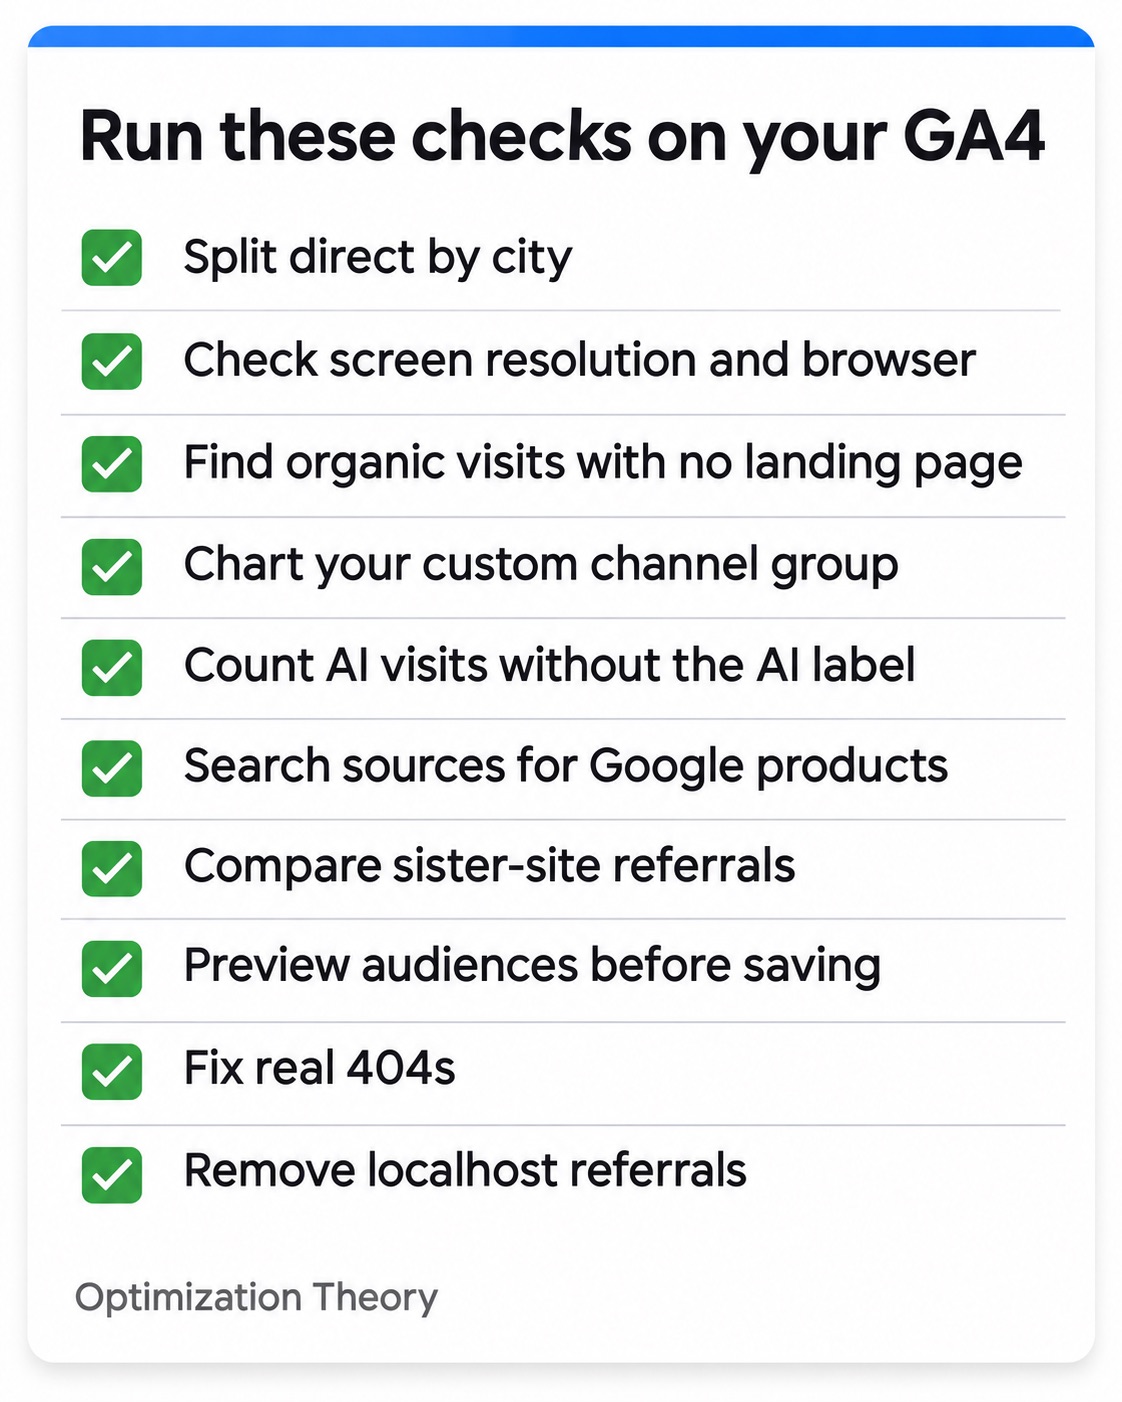
Run these checks on your own GA4
1Split direct traffic by city. Any city with hundreds of sessions and near-zero engagement is a bot source.
2Sort screen resolution and browser by sessions and look for 0-second rows such as 1280x1200 and Android Webview.
3Cross google / organic with landing page and look for "(not set)" landings.
4Chart channels with your custom channel group dimension over 90 days, not the primary channel group.
5Search the source table for gemini, perplexity, chatgpt and claude, and count what lacks the ai-assistant medium.
6Search the source table for "google" and see which Google products send referrals.
7Compare sister-site referrals with organic engagement if you run more than one site.
8Preview every user-property audience before saving. Rare audiences should look rare.
9Search the page audit table for "not found" and fix anything with real volume.
10Look for localhost and 127.0.0.1 in referrals.
Frequently asked questions
People also ask
What is direct traffic in Google Analytics?
Direct traffic is any session GA4 cannot attribute to a source: typed URLs, bookmarks, links from apps or documents that pass no referrer, and automated visits. Because it is the default bucket, bots often land there, so check direct traffic by city, screen resolution and landing page before treating it as loyal visitors.
Why is my direct traffic so high in GA4?
The most common causes are bot traffic from data centers, app and email clicks without a referrer, and missing UTM tags on your own campaigns. If one city or screen resolution accounts for a large share of direct sessions with near-zero engagement, it is almost always automated traffic.
How do I identify bot traffic in Google Analytics 4?
Build a table for each of city, country, screen resolution, browser and landing page with sessions, engagement rate and average session duration. Bot traffic shows up as rows with high sessions, engagement rates near zero and session durations of zero to a few seconds, often concentrated in one city or one unusual screen size.
Why do I see traffic from Dronten, Netherlands in Google Analytics?
Dronten hosts commercial data center capacity, and traffic geolocated there with near-zero engagement and zero-second sessions is typically automated rather than human. Treat it as bot traffic in reporting, and block it at your CDN or firewall if it is heavy.
Does GA4 track ChatGPT and other AI traffic automatically?
Partly. Since May 2026, GA4 labels recognized assistants such as chatgpt.com and gemini.google.com with the medium ai-assistant. Visits tagged only with a UTM source, smaller assistants such as duck.ai and Google's NotebookLM still arrive under other mediums, so a custom AI channel is needed to count all of them.
Why does NotebookLM traffic show as a referral in GA4?
NotebookLM clicks arrive with the referrer notebook.google.com, which GA4 does not treat as an AI assistant, so they fall into the Referral channel. Add notebook.google.com to your custom AI channel's source regex to count them with other AI visits.
Why does my GA4 audience include almost all users?
If an audience condition uses a broad regex such as .+ on a user property, users without that property are evaluated as "(not set)," which matches. Use a stricter pattern such as ^[a-z_]+$ and check the audience summary before saving, since conditions cannot be edited afterward.
The GEO Power User series
Read the whole series
Three parts, one setup: collect the right data, see it in dashboards, then use it to find what default GA4 hides.
Part 3You are hereWhat My GA4 Power Setup Found90 days of real data: a data center bot in Direct, AI visits GA4 mislabels and the audience regex trap.
Want this run on your sites?
I find what your GA4 is hiding.
Bot forensics, AI traffic tracking, the six SEO dashboards and a clean-data setup, run on your properties with a written report of what turned up. Call or text 973.985.6930.
To provide the best experiences, we use technologies like cookies to store and/or access device information. Consenting to these technologies will allow us to process data such as browsing behavior or unique IDs on this site. Not consenting or withdrawing consent, may adversely affect certain features and functions.
Functional
Always active
The technical storage or access is strictly necessary for the legitimate purpose of enabling the use of a specific service explicitly requested by the subscriber or user, or for the sole purpose of carrying out the transmission of a communication over an electronic communications network.
Preferences
The technical storage or access is necessary for the legitimate purpose of storing preferences that are not requested by the subscriber or user.
Statistics
The technical storage or access that is used exclusively for statistical purposes.The technical storage or access that is used exclusively for anonymous statistical purposes. Without a subpoena, voluntary compliance on the part of your Internet Service Provider, or additional records from a third party, information stored or retrieved for this purpose alone cannot usually be used to identify you.
Marketing
The technical storage or access is required to create user profiles to send advertising, or to track the user on a website or across several websites for similar marketing purposes.