

- October 28, 2026
- Artificial Intelligence, Black Hat SEO, GEO & AEO, SEO, SEO Infographics
Visual SEO guide · 9 stops · 4 lines
About 9 results · sorted by route, not by rank
Where these live: every infographic in this guide is published on my infographic site, Infographiac. Each preview, button and link below opens the full infographic and companion guide in a new tab, so you can keep this map open while you explore.
This is the departure hall for my SEO infographics, all published on Infographiac. Nine visual SEO guides, mapped like a transit system, take you from SEO vs AEO vs GEO and AI query fan-out to PageRank, black hat SEO, Google search operators, guestographics and a 470,691-result study on whether infographics for SEO still work.
Pick a line, ride it stop by stop, or jump straight to the SEO infographic that answers today's question. Every stop includes a preview of the infographic, the key numbers, what the SEO visual teaches and where to transfer next.
The SEO infographics transit map
Each colored line is an SEO discipline. Each station is one SEO infographic. Interchange stations, drawn as wide white capsules, are the visual SEO guides that connect two disciplines. Tap any station to jump to it.
What are SEO infographics? SEO infographics are visual guides that explain search engine optimization concepts, data and workflows in a single image: how Google ranks pages, how link equity flows, how AI search engines choose citations, which search operators still work and how to promote content. The best SEO infographics pair the visual with a written, crawlable companion article, so the infographic can rank in Google Images while the text ranks in web search and gets cited in AI answers.
How to use this visual SEO guide
Most collections of SEO infographics are a pile of pretty images with no order. This SEO infographic hub is organized the way you actually learn search engine optimization: by discipline, by dependency and by the problem you are trying to solve. Think of each SEO infographic as a station and each discipline as a line. Ride a line to master a topic end to end, or use the route planner below to jump to the SEO visual that solves your current problem.
Four lines run through this SEO infographics collection:
Route planner: which SEO infographic should you open first?
| If you want to... | Start at | Then transfer to |
|---|---|---|
| Understand SEO vs AEO vs GEO in one sitting | Stop 1 | Stop 2 |
| Learn why AI Overviews cite pages that don't rank #1 | Stop 3 | Stop 1 |
| Build a 90-day generative engine optimization plan | Stop 2 | Stop 8 |
| See how internal links and backlinks pass authority | Stop 4 | Stop 6 |
| Vet an SEO agency pitch or spot link spam | Stop 5 | Stop 4 |
| Earn links with infographics the ethical way | Stop 6 | Stop 9 |
| Run faster technical SEO audits in Google | Stop 7 | Stop 8 |
| Automate keyword research and SEO reporting with AI | Stop 8 | Stop 7 |
| Decide whether infographic submission sites are worth it | Stop 9 | Stop 6 |
SEO vs AEO vs GEO: the complete AI search optimization infographic
Every SEO infographic on this map starts here, because the biggest question in search engine optimization right now is how classic SEO relates to AEO (answer engine optimization) and GEO (generative engine optimization). This SEO vs AEO vs GEO quick reference infographic treats the three as connected lenses, not rival disciplines. SEO earns rankings, clicks and organic discovery. AEO makes a concise answer easy to extract inside search and assistant experiences. GEO focuses on inclusion, citations and recommendations inside generative answers from Google AI Overviews, AI Mode, ChatGPT Search, Perplexity, Claude and Gemini.
 2026 SEO + AEO + GEO Quick ReferenceOpen guide →
What this SEO infographic teaches
- The search-to-answer process: access, retrieve, rank and select, synthesize, cite or recommend, then act. The infographic draws it as one pipeline, so you can see exactly where SEO ends and GEO begins.
- Four AI visibility outcomes: a blue link, a quoted source, a recommendation or an uncredited influence. Each needs its own measurement.
- Answer-first content structure for AEO, plus entity SEO and structured data that help AI systems understand who stands behind a page.
- Technical SEO for AI crawlers: the difference between search and training crawlers, and what Google-Extended and llms.txt actually do.
For Google specifically, the guide notes that optimizing for AI Overviews and AI Mode is still SEO, since Google says its generative features run on its existing search and quality systems. That is why this AI search optimization infographic is the origin station: you cannot do GEO without the SEO foundation underneath it.
Best for: marketers, founders and SEO leads who need one visual SEO guide to explain SEO, AEO and GEO to a team or client.
Board Stop 1 →The 2026 GEO deep dive: how SEO, AEO and GEO work together
Where Stop 1 defines the terms, this generative engine optimization infographic turns them into a process. The 2026 GEO Deep Dive organizes search everywhere optimization into five connected responsibilities: Access, Answer, Prove, Connect and Measure. A well-built page can attract an organic visit, supply a direct answer and support an AI-generated response at the same time, and this GEO infographic shows how to plan for all three outcomes without splitting your SEO strategy into silos.
 The 2026 GEO Deep DiveOpen guide →
The five GEO responsibilities, decoded
- Access: make important information reachable in the initial response and the rendered page before you try to optimize it. Separate discovery permissions from AI training preferences.
- Answer: build sections that stand on their own, with a repeatable structure that AI search engines can lift without losing context.
- Prove: make every important claim inspectable with sources, data and original evidence.
- Connect: explain who you are with entities and structured data that describe the real page, and build a credible presence beyond your own website.
- Measure: track visibility, accuracy and business outcomes separately with a stable question set and current Search Console reporting.
The scope covers Google AI features, Gemini, ChatGPT Search and Perplexity, and treats each one as its own observation surface. If Stop 1 is the SEO cheat sheet, this GEO SEO infographic is the operating manual.
Best for: SEO teams turning AEO and GEO theory into a 90-day plan with clear measurement.
Board Stop 2 →AI query fan-out: how rankings become answers
Why does an AI Overview cite a page that sits on page two while skipping the #1 result? This query fan-out infographic answers it visually. One visible prompt becomes several hidden searches: the system rewrites the prompt, fans it out into related queries, retrieves a separate ranked candidate set for each, reranks passages and then cites only a fraction of what it read. Google's documented term is query fan-out, a set of concurrent, related, model-generated queries used to gather additional results.
 AI Query Fan-Out for SEO ExpertsOpen guide →
What the fan-out SEO visual shows
- The system decides whether to search at all.
- The prompt becomes one or more retrieval queries.
- Each query creates its own ranked candidate set.
- Candidate lists are combined, then re-evaluated for answer utility.
- Passages compete for a limited context budget.
- The model synthesizes an answer and maps claims to sources, and only some become visible citations.
The practical takeaway for LLM SEO and AI Overviews SEO: optimize for a task graph, not a page per phrase, and preserve foundational SEO, because traditional rankings are the upstream retrieval foundation even though they are not a deterministic citation order. The companion guide labels every claim as documented, supported inference, observed or unknown, which makes it one of the most careful generative engine optimization infographics available.
Best for: technical SEOs and analysts explaining AI citation volatility with real data.
Board Stop 3 →PageRank explained visually: following the flow of link equity
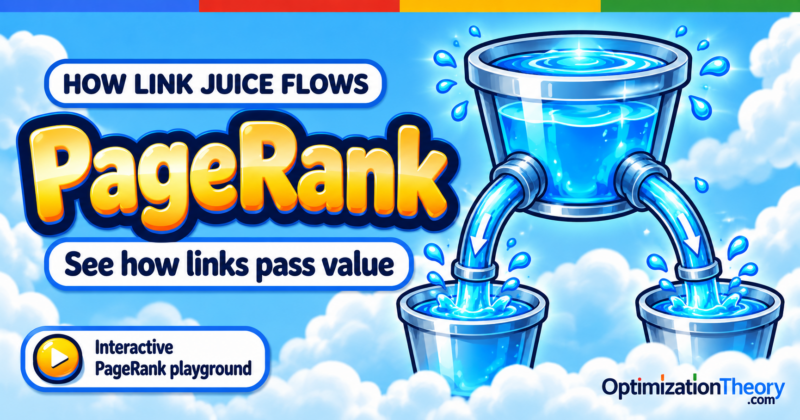
This PageRank infographic redraws Google's original PageRank algorithm as buckets, pipes and valves. A bucket is a page, and its water level is the value it holds. A pipe is a link, and the stream inside shows how much link equity (better known as link juice) it carries. A red valve is a nofollow link: it still takes its share of the split, but only a drip may get through. Once you see link juice flow, internal linking, orphan pages and link dilution stop being abstract SEO terms.
 How Link Juice FlowsOpen guide →
The PageRank formula, as pipe math
The SEO infographic reduces the PageRank formula to one line: value passed = page value × 0.85 ÷ number of outbound links. Page A holds 80, sends 80 × 0.85 = 68 through its pipes, and each of its two links carries 34. A page with three outbound links splits its flow three ways, and a page fed by two pipes adds them together. The guide also covers what search looked like before PageRank, when rankings were easy to fool, and why big brands hold so much link equity.
It is the clearest visual SEO explanation of why a focused internal link from a strong page beats a sitewide footer link, and why a 100-link directory passes almost nothing per link.
Best for: anyone learning how backlinks and internal links pass authority, from SEO beginners to clients asking why links matter.
Board Stop 4 →Black hat SEO 2026: the manipulation stack infographic
The Black Hat Terminal is a black hat SEO infographic built like a hacker's console. It connects six manipulation mechanisms into one map, so you can see how search signals get manufactured, borrowed and disguised. Black hat SEO uses deceptive or manipulative techniques to make a page appear more relevant, authoritative or popular than the evidence behind it supports. This SEO infographic is not a how-to. It is a field guide for recognizing those black hat SEO techniques in an agency pitch, a backlink report or a suspicious search result.
 Black Hat Terminal: The Manipulation StackOpen guide →
The six black hat SEO methods on the map
- Cloaking and sneaky redirects: one URL, two realities, with crawlers and visitors receiving different experiences.
- Private blog networks, link spam and expired domains: many apparent publishers, one decision-maker behind the links.
- Parasite SEO: borrowing an established host's site reputation for content it doesn't really oversee.
- Scaled content abuse: multiplying pages without multiplying value, whether written by templates, people or generative AI.
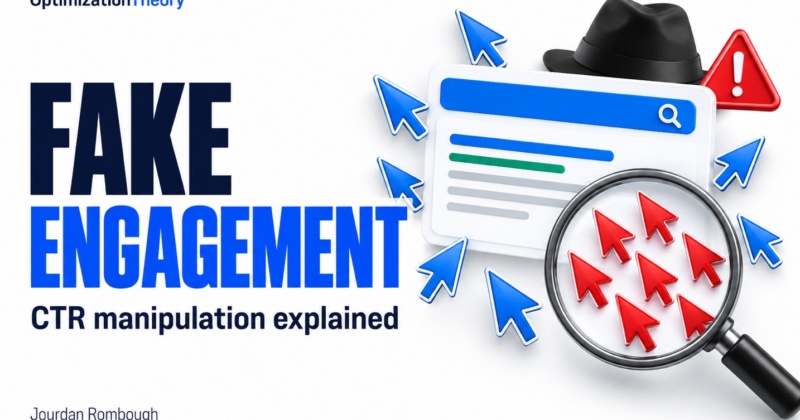
- CTR manipulation and fake local signals: performing popularity instead of earning it.
- AI search and prompt injection: attempts to influence generated answers, which Google's spam policies now cover too.
The white hat vs black hat test the guide recommends is simple: does the work improve the information or experience, or does it fabricate the evidence used to judge it? Read alongside the PageRank SEO infographic, it shows exactly why link spam targets link equity and why Google's link spam, expired domain and site reputation policies exist.
Best for: business owners vetting SEO vendors and SEOs auditing a backlink profile or a sudden traffic spike.
Board Stop 5 →Guestographics: the infographic marketing guide to better guest posts
This is the interchange where SEO infographics become backlinks. A guestographic is an infographic you offer to another website as a guest post, with a short, unique write-up attached, in exchange for a credited link back to your site. It blends guest posting with infographic outreach: the publisher gets free, ready-to-run visual content, and you earn an editorial backlink inside relevant content instead of a boilerplate embed-code link from a directory nobody visits.
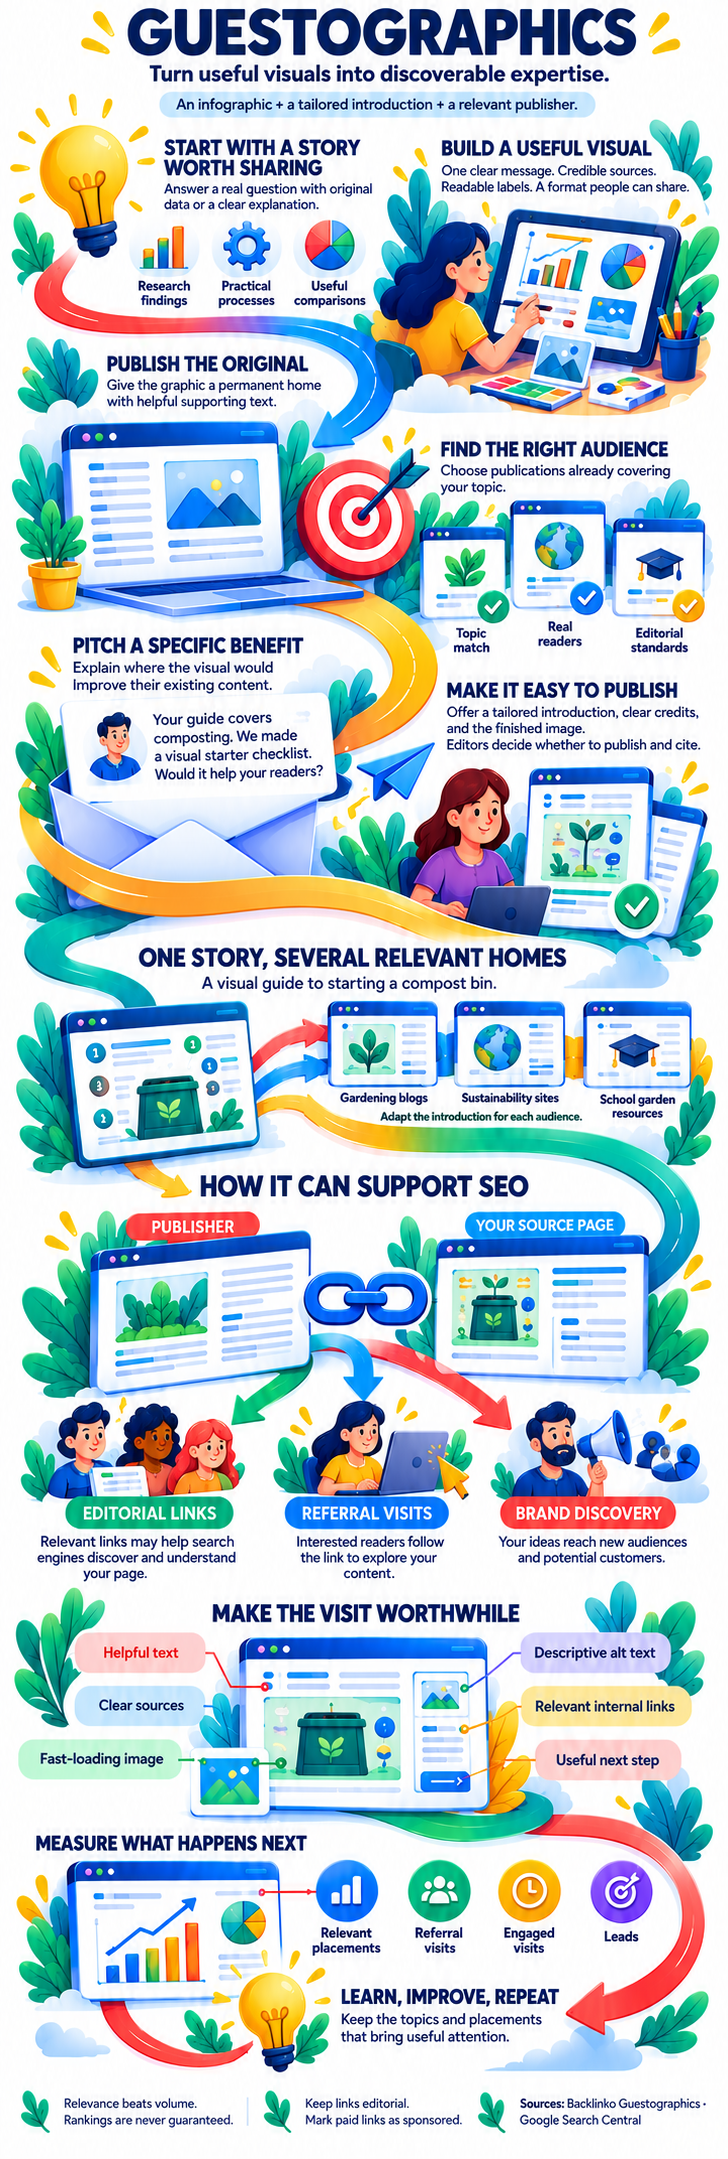 Guestographics: Useful Visuals, Discoverable ExpertiseOpen guide →
The guestographic method in six steps
- Pick a topic publishers already cover.
- Build it on real data, with credible sources.
- Design for readability, not just looks.
- Publish the original on your own site first.
- Build a prospect list of relevant sites.
- Pitch, then deliver something custom for each publisher.
The guide compares guestographics with infographic submission sites using 2026 data, and the conclusion is blunt: hand-picked placements on sites real people read beat broadcasting your SEO infographic to directories. It is the most practical infographic marketing playbook on this map, and the only one with copy-and-paste outreach templates.
Best for: content marketers and link builders who want infographic link building that survives Google's link spam policies.
Board Stop 6 →Google search operators in 2026: 12 power stacks for SEO
Most SEOs learned Google search operators years ago and never checked them again. This search operators infographic rebuilds the playbook against Google's own documentation: which operators still work, which ones Google killed and how to stack them for technical SEO audits, content planning, competitor research and link building. It is a transfer station because the same operator stacks power both site audits on the green SEO Toolkit Line and link prospecting on the red Link Equity Line.
 Google Search Operators 2026Open guide →
Anatomy of an SEO query
The infographic teaches a four-step query pattern: scope with site:, filter with intitle: or inurl:, keep phrases exact with quotes and exclude noise with a minus. For example: site:example.com intitle:"search operators" -inurl:tag.
The operator graveyard is worth the visit alone: + (2011), ~ (2013), link: and info: (2017), related: (mid 2023), cache: (September 2024) and &num=100 (September 2025), each with the tool to use instead. The 12 power stacks solve real problems like index bloat after a theme update, a dev copy that went public, keyword cannibalization, mapping a competitor's topic cluster and placing an infographic on resource pages. The guide also flags six 2026 gotchas, including AI Overviews that sometimes ignore your exclusions.
Best for: technical SEOs, auditors and link builders who live in Google's search bar.
Board Stop 7 →Claude + DataForSEO prompt builder: 16 ready SEO jobs
The SEO Expert's Secret Weapon infographic shows how Claude Code and the DataForSEO API work together as an SEO engine: DataForSEO supplies the evidence (keyword, SERP, competitor, backlink and AI search data), Claude reads files, calls tools and builds outputs, and you review and ship the deliverable. The companion page is a free interactive prompt builder with no sign-up. Type in your website, market, topic and two competitors once, and all 16 SEO prompts rewrite themselves for you.
 SEO Expert's Secret Weapon: Claude Code + DataForSEOOpen tool →
The 16 SEO prompts, by category
| Category | Jobs | Examples |
|---|---|---|
| Keyword research | 3 | Keyword research and clustering, striking-distance opportunities, competitor keyword gap |
| Technical SEO | 4 | Crawl audit to fix list, migration redirect map, structured-data review, AI crawler log check |
| Content + AI visibility | 4 | Brief from the live SERP, bulk titles and descriptions, AI citation tracking, original research study |
| Reporting | 3 | Weekly rank tracking, GA4 report on demand, paid and organic overlap |
| Ecommerce + local | 2 | Product listing audit, local SERP check |
Each prompt tells you what to bring, what to ask and what you get back, and every prompt asks Claude to report sources, limits and API cost. It is the bridge between the SEO Toolkit Line and the AI Search Line: the same workflows that run keyword research can also check AI visibility for the GEO work at Stops 1 to 3.
Best for: SEOs who want Claude SEO workflows backed by real DataForSEO data instead of guesses.
Board Stop 8 →Infographics for SEO: what 470,691 image results revealed
Do infographics still help SEO? The 2026 Infographic SEO Exposé answers with data: 27 infographic submission sites, 2,150 sampled posts and 470,691 Google image results. The short answer is yes, but mostly in Google Images, and only on a handful of sites. This is the station that tells you where SEO infographics actually get seen, which makes it required reading before you design, publish or distribute your next infographic.
 The 2026 Infographic SEO ExposéOpen study →
What the infographic SEO data says
- Images beat web search: for "topic + infographic" searches, submitted posts reached the Google Images top 10 13.7% of the time versus 5.4% in web results. Without the word "infographic," the split was 10.1% to 2.8%.
- A few sites do almost all the work: Cool Infographics, Industry Today and eLearning Infographics held about 93% of the top-10 web keywords measured across 24 sites, and 14 sites had none.
- Link scores didn't predict reach: two sites one point apart on link rank had wildly different visibility.
- Credit matters: when a post credited its source, the creator's own domain appeared in the Images top 100 more often (25.6%) than the submission post (14.1%).
For anyone building SEO infographics, the lesson is to treat image SEO as a primary channel, publish the original on your own site with strong alt text and context, and choose distribution partners by real visibility rather than domain metrics. That is exactly why the amber line connects this study to guestographics at Stop 6.
Best for: anyone deciding whether infographic submission sites and infographic SEO are worth the time in 2026.
Board Stop 9 →Why SEO infographics still work in 2026
Search engine optimization is full of systems that are hard to picture: link equity moving through a site, a prompt fanning out into hidden queries, an AI answer choosing three sources out of fifty. SEO infographics compress those systems into one image you can understand in seconds and share in a meeting. That is the real job of a visual SEO guide: not decoration, but faster understanding.
The data at Stop 9 shows infographics for SEO earn most of their search visibility in Google Images, where an infographic SEO strategy can win 2.5 times more often than in web results. Pair that with a crawlable companion article and the same SEO infographic can rank in web search, appear in image results and get cited in AI answers. Every infographic in this SEO infographics hub follows that model: a high-resolution visual plus an in-depth written guide.
Infographic SEO checklist for your own visuals
Publish the original on your own site first, so search engines and AI systems see you as the source of the SEO infographic.
Write descriptive alt text and a descriptive file name. The study found only 53% of infographic posts had any alt text at all.
Add a companion article with the key numbers in HTML text, so the information is crawlable, quotable and citable by AI search.
Show sources and dates on the infographic and in the article. Evidence is what AEO and GEO systems reward.
Distribute with guestographics to relevant publishers instead of mass submission to infographic directories.
Ask for a credit link to the original page, not just the image file, so link equity reaches the page that can rank.
SEO infographic glossary: terms you'll see on this map
A quick reference for the SEO terms that appear across these SEO infographics, so the visual SEO guides make sense even if you jump straight to one stop.
- SEO (search engine optimization)
- Helping search systems discover, understand, index and rank content to earn qualified organic visibility.
- AEO (answer engine optimization)
- Making information easy to extract as a direct answer in featured snippets, voice and assistant responses.
- GEO (generative engine optimization)
- Improving the chance that AI-generated answers retrieve, cite and accurately represent your content.
- Query fan-out
- Google's term for concurrent, related, model-generated queries an AI search system runs to gather more results.
- PageRank
- Google's original link analysis algorithm, which models authority flowing between pages through links.
- Link equity (link juice)
- The ranking value a link passes from one page to another, split across a page's outbound links.
- Damping factor
- The 0.85 value in the PageRank formula: only 85% of a page's value flows through its links.
- Nofollow
- A link attribute that tells search engines not to treat the link as an endorsement; drawn as a red valve at Stop 4.
- Black hat SEO
- Tactics that violate search engine spam policies to fake relevance, authority or popularity.
- Parasite SEO
- Publishing on an established site mainly to exploit its ranking signals, covered by Google's site reputation abuse policy.
- Guestographic
- An infographic offered to another site as a guest post with a unique intro, in exchange for a credited link.
- Search operator
- A command like site: or intitle: that narrows Google results for audits and research.
- AI Overviews
- Google's AI-generated summaries at the top of search results, which cite a selection of supporting pages.
- Image SEO
- Optimizing images, including infographics, with file names, alt text and context so they rank in Google Images.
SEO infographics FAQ
What are SEO infographics?
SEO infographics are visual guides that explain search engine optimization concepts, data or workflows in a single image, such as how PageRank passes link equity, how AI search chooses citations or which Google search operators still work. The most useful SEO infographics come with a written companion article so the information is crawlable and citable.
Do infographics still help SEO in 2026?
Yes, mostly through Google Images. A study of 27 infographic submission sites, 2,150 posts and 470,691 image results found submitted infographics reached the Google Images top 10 13.7% of the time versus 5.4% in web results, about 2.5 times more often. Visibility was concentrated on a handful of sites.
What is the difference between SEO, AEO and GEO?
SEO builds discoverability and rankings. AEO makes useful answers easy to identify and present directly. GEO extends that work into AI-generated responses, citations, mentions and recommendations. They share the same foundation of accessible, relevant, credible content, and for Google, optimizing for AI features is still part of SEO.
What is query fan-out in AI search?
Query fan-out is Google's term for the concurrent, related, model-generated queries an AI search system runs to gather more results. One visible prompt can become several hidden searches, each with its own ranked results, which is why AI Overviews often cite pages that don't rank first for the original query.
How does PageRank pass link equity?
In the original PageRank formula, a page passes its value multiplied by a 0.85 damping factor, divided by its number of outbound links. A page worth 80 with two links sends 34 through each link, and the remaining 15% never enters the links at all.
Which Google search operators still work in 2026?
Twenty-one operators still work, including quotes, minus, OR, site:, inurl:, intitle:, intext:, filetype:, before: and after:. Nine are dead or unreliable, including link:, info:, related:, cache:, which Google switched off in September 2024, and the &num=100 parameter, removed in September 2025.
What is a guestographic?
A guestographic is an infographic you offer to another website as a guest post, with a short unique introduction written for that publisher's audience, in exchange for a credited link back to your site. It earns an editorial backlink inside relevant content rather than a boilerplate embed link.
More Writing & Research by Jourdan Rombough
View all research

If AI can't find you, understand you and trust you, it won't recommend you.
Keywords tell you what they typed. Intent tells you what they meant. Fan-out tells you what they'll ask next.
Be a thing, not a string. AI remembers entities, not keywords.
The click isn't dead. It just has to be earned twice.
Schema is the business card you hand to every machine that reads your site.
If Googlebot can't reach it and AI can't parse it, it doesn't exist.
Good SEO grows quietly. Then all at once.
